PROJECT 3
In the following project, we are asked to define a problem and show our data understanding over a dataset we have chosen.

Introduce the problem
What regression model and features could be used to predict house prices?
Introduce the data
The data I will be using is a house prices dataset that includes common specifications for housing such as LotArea, LandSlope, SaleType, and MSSubClass: here!
.png)
Pre-processing the data
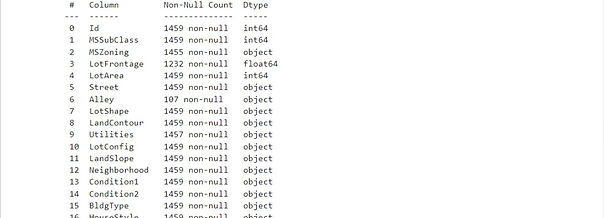
1. Check the data- Using the info() and/or dftypes methods to see the datatypes of the different fields in the dataset and I tried focusing on numerical datatypes rather than categorical ones.
2. Next, I used scatterplots to see which datatypes that may have a correlation with each other. I found that LotArea and LotFrontage may have potential as features in the model.
3. After I have found my target features through graphing I make sure they do not have any missing/NaN values from their datasets.
4. Lastly I dropped irrelevant columns that are not being used in the current experiment because in return when this will help aggregate through the data easier and not overfit the model.
_edited.jpg)
_edited.jpg)
_edited.jpg)
_edited.jpg)
Data Understanding/Visualization
Experiment 1
The regressional model I decided to use was PCA (Principle Component Analysis), I chose this model because since I am just more than one feature this model can best serve the purpose of showcasing how much the two attributes contribute to dictating the house price. So that is what I try to showcase with my first experiment.
As I said in my Pre-processing section, the features I wanted to focus on were LotArea and LotFrontage so those are the two features that I have denoted in my data frame.
Then I have to standardize my data and used the following code to complete that implementation:
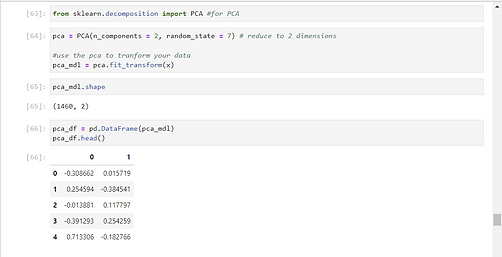
Now that it is standardized I was able to implement the PCA model:
Based on the 3D graph the data is still polarized to a specific direction of the plane field, probably because there are house values that are closely the same or because of any NaN or missing value I have filled with the mean value favored a specific value in an interval that is consisted in lower numbers? Things to consider and maybe be possible but I do want to further analyze other features or maybe combine 2 more features with LotArea and LotFrontage to see if the visualization would improve. As for the accuracy time I was not able to reach it because of system errors that continued to persist but I hope to find an alternative to seeing the accuracy of the PCA model.
For this experiment, I want to be able to see what other features may have a correlation with Price so I implemented a heatmap to see which feature has a high correlation with SalePrice. Based on my analysis, "OverallQual" besides "Id" has a high correlation with this field.
As for the visualization I will use Linear Regression to help predict the Sales Price based on OverallQual So I first defined OverallQual as a feature(x) and Sales Price as a target(y). Then I was able to define the Linear Regression model to predict the target output which is explained below with my final finding for this experiment.
After I have finished setting up the model I was ready to predict the SalePrice based on OverallQual. For the example below I used one of the common values for OverallQual, 7.
So the predicted value was around $221,179.50 which is around the similar range some of the Sale Prices are. Lastly, to see how close or far I was from the actual value I calculated the mean_squared_error which turned out to be around 8.313 which is better than it being a triple number so I am close to the target value.
For this experiment, I decided to still use the PCA model but this time with different features which were: OverallQual, LotArea, and LotFrontage . First I defined them as a list of features for the model.
Next, I define and declare the PCA model with the following lines of code:
Then as for the visualization, I have realized there was a bit more improvement from the first experiment and I believe it may be because of the new feature added that has more input about the state of the price. It seems that there are a little bit more values that were able to be taken into account in the visualization but more adjustments could be made to improve the model overall.
_edited.jpg)
.png)
_edited.jpg)
Experiment 2
_edited.jpg)
_edited.jpg)
_edited.jpg)
_edited.jpg)
Experiment 3
_edited.jpg)
_edited.jpg)
Storytelling
House prices dictation can vary by market, by the house type/structure, and even location but within this dataset, a house's value could be assigned based on the number of bathrooms it has, the quality of it overall, and the size of the house. Those were factors I tried to consider when trying to determine which are important to stating the price of a home. From my own experience size means everything, so LotArea and LotFrontage stuck out to me based on the descriptions that the Kaggle source provides for each of them. But I do wonder if MSSubClass or the quality of the house can play a part in naming the price for the house as well.
My Code
You can view the code I wrote for my project here.